
The CFO Handbook | GP Bullhound
The CFO Handbook For B2B SaaS First Edition
2 THE VIEW FROM GP BULLHOUND GP BULLHOUND The view and methodology This handbook aims to provide a comprehensive overview for CFOs and software companies on how modern B2B SaaS organizations can be run to ensure high performance and a culture of continuous improvement. The handbook covers both standard and industry-specific metrics used in a subscription software company, with a focus on understanding how to best leverage these metrics to measure a business performance and growth. Additionally, it provides benchmarks for various performance levels to give context to a company's performance. The structure and components of a software company's income statement and balance sheet are explained, as well as the connection between industry-specific metrics and traditional revenue and cost reporting. Also, the processes of a software company's sales organization are discussed in detail as they are inherently linked with the finance organization. Through interviews with high-performing B2B SaaS businesses, the handbook also highlights how their CFOs, finance teams, and organizations leverage the above to operate at the highest level. In addition, examples of software products for companies at different stages of development are included to inspire CFOs and their finance teams should they need assistance in building their tech stack. Lastly, an appendix is included with templates for effective reporting of the metrics discussed, ensuring consistency for all stakeholders in a B2B SaaS company. Authors ASSOCIATE ANALYST Gustav Fridell Chee Meng Ng
3 THE CFO HANDBOOK FOR B2B SAAS The CFO Handbook For B2B SaaS CHAPTER 1 Metrics and performance measurements CHAPTER 2 Financial statements and reporting CHAPTER 3 Perfomance benchmarks CHAPTER 4 Operational best practices CHAPTER 5 The finance software stack CHAPTER 6 Reporting templates
4 THE CFO HANDBOOK CHAPTER 1 FOR B2B SAAS Metrics and performance measurements Recurring revenue Retention rates Growth and profitability Unit economics Burn and capital efficiency Debt metrics Sales metrics
5 METRICS AND PERFORMANCE CHAPTER 1 MEASUREMENTS Recurring revenue As most software companies sell their products as subscriptions, one of the most common representation of their size and growth is on a recurring revenue basis. While contract lengths can vary, it is standard to normalize and present recurring revenue on a monthly or annual basis. The chosen duration most often based on of the majority of the company's customer contract lengths. Metric Description MRR Monthly Recurring Revenue (MRR) is the recurring revenue from all customers on subscription contracts normalized on a monthly basis. MRR is always equal to a month worth of ARR, and one-time revenues are not to be included. ARR Annual Recurring Revenue (ARR) is the recurring revenue from all customers on subscription contracts normalized on an annual basis. ARR is always equal to a year worth of MRR, and one- time revenues are not to be included. In practice, ARR is defined as last month’s MRR times 12. Breaking down recurring revenue into its components helps to explain the factors that contribute to its change from one period to another. Metric Description Retained ARR Recurring revenue retained from existing customers of the previous period. Expansion ARR Recurring revenue added from existing customers of the previous period. Contraction ARR Recurring revenue lost due to contract downgrades from existing customers of the previous period. Churned ARR Recurring revenue lost due to full contract cancellations from existing customers of the previous period. Resurrected ARR Recurring revenue added from former customers. New sales ARR Recurring revenue added to this period from new customers. Change ARR to MRR if you are comparing changes in recurring revenue between months instead of years. EXAMPLE OF AN ARR BRIDGE Q3 2022 Actual In $'000s Q3 2022 Q3 2021 YoY Growth Q2 2022 vs. last Qtr Q3 2022B vs. Budget ARR (BOP) 15,000 13,000 15% 14,000 7% 14,500 3% (+) New Business 5,000 4,500 11% 4,500 11% 7,500 (33%) (+) Upsell 1,500 3,000 (50%) 1,000 50% 3,000 (50%) (+) Resurrected - - - - - - - (-) Contraction 250 200 25% 200 25% 300 (17%) (-) Churn 450 900 (50%) 900 (50%) 900 (50%) ARR (EOP) 20,800 19,400 7% 18,400 13% 23,800 (13%)
6 CHAPTER 1 METRICS AND PERFORMANCE MEASUREMENTS Recurring revenue can also be measured at the account and user level. Metric Description Formula ARPA Average Revenue Per Account (ARPA) measures how much Total ARR recurring revenue one of the company’s customers generates on average. ARPA can be measured on a monthly, quarterly, and Total # of annual basis, making it necessary to specify which it refers to customers accounts when presenting the metric. ARPU Average Revenue Per User (ARPU) is similar to ARPA, though instead of the average revenue per customer account, it Total ARR measures the average revenue per user since one customer account can have multiple users. For consumer software, ARPA is Total # of users usually equal to ARPU, as the customer is the same as the user. Change ARR to MRR if you are comparing changes in recurring revenue between months instead of years. Retention rates Retention rates are among the most important metrics as they are able to explain everything from product-market-fit to sales performance and customer satisfaction. These rates measure how good a company is at retaining customers and recurring revenue after a certain period and are calculated by splitting customers into smaller groups called "cohorts" based on when they signed up, by month, quarter, or year. In addition to analyzing the company's customers across time-based cohorts, it can be helpful to segment them further by aspects such as customer size, industry, or region. For example, if enterprises in the U.S. show better retention rates than SMBs in the Nordics, this insight could inform the company's sales strategy and ideal customer profile (ICP). SUMMARY TABLE OF RETENTION RATE DEFINITIONS Metric Description Formula Customer/Logo Logo retention Logo Retention is the measure of how large a # of customers remaining in cohort share of customers in a cohort remains after a Initial # of customers in cohort certain period. Logo churn Churn Rate is the inverse of logo retention and instead measures how large a share of customers 100% − logo retention in a cohort has left after a certain period. Revenue Gross revenue Gross Revenue Retention is the measure of how Initial ARR in cohort retention much of the initially acquired recurring revenue is - Contraction ARR remaining in a cohort after a certain period. - Churned ARR Initial ARR in cohort Net revenue Net Revenue Retention is the measure of how Initial ARR in cohort retention much recurring revenue a cohort generates + Expansion ARR after a certain period relative to how much was - Contraction ARR initially acquired. - Churned ARR Initial ARR in cohort
METRICS AND PERFORMANCE 7 CHAPTER 1 MEASUREMENTS 01 Logo Retention Customer, or "logo," retention is the measure of how many customers in a cohort remain after a certain period. Logo retention can be represented as a single figure. For example, if a company says they "have 67% logo retention," it means they have been able to retain 67% of their customers on average every 12 month, or 67% x 67% = 45% in two years. Cohort Cohort size Share of customers remaining #of customers Sign-up month added Month 0 Month 1 Month 2 Month 3 Month 4 Month 5 Month 6 Month 7 Month 8 Month 9 Month 10 Month 11 Month 12 Month 13 2021 July 178 100% 97% 93% 90% 87% 84% 82% 80% 78% 75% 73% 71% 60% 58% 2021 August 180 100% 97% 97% 93% 91% 89% 87% 84% 84% 82% 80% 78% 69% 67% 2021 September 149 100% 100% 97% 95% 92% 92% 89% 89% 87% 84% 81% 79% 68% 68% 2021 October 191 100% 98% 96% 96% 94% 92% 90% 87% 85% 83% 81% 79% 69% 2021 November 200 100% 98% 96% 94% 92% 90% 90% 90% 88% 88% 86% 86% D 2021 December 210 100% 98% 96% 94% 92% 90% 89% 87% 87% 87% 87% 2022 January 208 100% 100% 98% 98% 98% 98% 96% 96% 94% 92% 2022 February 179 100% 98% 98% 98% 98% 97% 96% 94% 94% C 2022 March 176 100% 100% 100% 100% 100% 100% 99% 98% 2022 April 227 100% 100% 99% 98% 97% 96% 96% 2022 May 193 100% 100% 100% 99% 99% 99% 2022 June 233 100% 99% 99% 99% 99% 2022 July 202 100% 100% 99% 98% 2022 August 243 100% 99% 99% B 2022 September 213 100% 100% 2022 October 215 100% A E Weighted average 100% 99% 98% 96% 95% 93% 91% 90% 87% 85% 82% 79% 67% 64% The weighted average logo retention rate is in relation to the number of customers added from each cohort. While the aggregate retention figure can be used to compare the company against others, it doesn't tell the full story, and that is not the reason why retention metrics are used. Instead, analyzing the developments of individual cohorts is what reveals how the company is performing. For example, looking at the table above, we can see that: A. The number of customers added each month is increasing, indicating the company is getting better at acquiring new customers. B. A larger share of customers remains from more recent cohorts than from older ones, indicating the company is either acquiring more sticky customers or they are getting better at customer success. C. There is a significant increase in the share of customers remaining between the December 2021 and January 2022 cohorts, indicating the company likely started identifying more sticky customer segments to target for new sales.

METRICS AND PERFORMANCE 8 CHAPTER 1 MEASUREMENTS D. There is a significant decrease in the share of customers remaining between months 11 and 12, indicating the company likely has customers on both monthly and annual subscription plans, where the ones on annual plans cannot churn until after a full year. E. On average, the company is able to retain two-thirds of the customers they acquire after the first full year. To combat this, they can either acquire new customers or work with customer success to retain the ones they already have. Almost always, it is easier to retain customers than to acquire new ones. WHAT GREAT LOOKS LIKE ▪ >95% logo retention for enterprise clients, >80% logo retention for SMB clients ▪ Increasing number of customers in each cohort


9 CHAPTER 1 METRICS AND PERFORMANCE MEASUREMENTS 02 Gross Revenue Retention Cohort Cohort size Share of initial MRR against remaining MRR (after contraction and churn) Initial $ MRR Sign-up month added Month 0 Month 1 Month 2 Month 3 Month 4 Month 5 Month 6 Month 7 Month 8 Month 9 Month 10 Month 11 Month 12 Month 13 2021 July 54,701 100% 98% 96% 93% 91% 91% 89% 89% 89% 87% 85% 85% 77% 75% 2021 August 44,136 100% 97% 97% 95% 94% 92% 90% 88% 86% 85% 83% 83% 74% 72% 2021 September 55,887 100% 98% 96% 94% 92% 92% 92% 90% 87% 85% 84% 83% 76% 75% 2021 October 46,883 100% 98% 97% 95% 93% 91% 90% 88% 88% 86% 85% 85% 78% 2021 November 49,531 100% 100% 98% 97% 97% 95% 93% 92% 92% 90% 88% 87% 2021 December 63,112 100% 98% 96% 95% 94% 92% 92% 91% 90% 90% 90% 2022 January 63,888 100% 100% 99% 99% 99% 99% 97% 96% 95% 95% 2022 February 63,112 100% 99% 99% 97% 96% 95% 95% 95% 95% 2022 March 64,986 100% 99% 98% 98% 98% 96% 95% 95% 2022 April 56,902 100% 100% 100% 100% 99% 99% 99% 2022 May 57,113 100% 99% 99% 99% 99% 99% 2022 June 57,561 100% 100% 100% 99% 99% 2022 July 72,004 100% 100% 100% 99% 2022 August 75,163 100% 99% 99% 2022 September 75,864 100% 100% 2022 October 75,693 100% Weighted average 100% 99% 98% 97% 96% 95% 94% 92% 91% 89% 86% 84% 76% 74% The weighted average gross revenue retention rate is in relation to the initial MRR or ARR added from each cohort. Gross revenue retention is similar to logo retention, but instead of measuring how many of the initially acquired customers remain, it measures how much of the initially acquired recurring revenue remains. By analyzing gross revenue retention, you can draw similar conclusions as you would from analyzing logo retention. However, if you compare the two figures, you gain additional insights about the company. If gross revenue retention is higher than logo retention, the company is better at retaining its larger, more revenue-generating customers. If gross revenue retention is lower than logo retention, it suggests the opposite. In the example, where the one-year average gross revenue retention is 76% and the logo retention is 67%, we can immediately see that the company is better at retaining its higher paying customers. WHAT GREAT LOOKS LIKE ▪ >90% gross revenue retention for enterprise clients, >80% gross revenue retention for SMB clients ▪ Retention is consistent across the cohort and not driven by a few power-users
10 CHAPTER 1 METRICS AND PERFORMANCE MEASUREMENTS 03 Net Revenue Retention Cohort Cohort size Cohort’s total MRR relative to its initial MRR (after expansion, contraction, and churn) Initial $ MRR Sign-up month added Month 0 Month 1 Month 2 Month 3 Month 4 Month 5 Month 6 Month 7 Month 8 Month 9 Month 10 Month 11 Month 12 Month 13 2021 July 42,162 100% 98% 98% 98% 97% 97% 97% 97% 98% 99% 100% 101% 96% 99% 2021 August 55,433 100% 103% 103% 104% 104% 104% 105% 105% 105% 106% 107% 108% 104% 107% 2021 September 56,681 100% 103% 103% 104% 104% 105% % 105% 107% 108% 109% 111% 107% 110% 105 2021 October 58,264 100% 103% 103% 104% 104% 105% 105% 106% 108% 109% 111% 112% 108% 2021 November 46,314 100% 103% 106% 107% 109% 112% 112% 113% 114% 115% 117% 120% 2021 December 58,841 100% 103% 106% 107% 108% 109% 112% 114% 115% 116% 118% 2022 January 49,172 100% 105% 108% 108% 109% 112% 114% 115% 118% 119% 2022 February 63,241 100% 105% 108% 110% 113% 114% 115% 116% 117% 2022 March 66,295 100% 105% 106% 109% 111% 113% 115% 118% 2022 April 67,559 100% 104% 105% 108% 110% 111% 114% 2022 May 57,715 100% 104% 106% 109% 110% 113% 2022 June 70,583 100% 105% 108% 110% 112% 2022 July 60,505 100% 105% 108% 109% 2022 August 74,126 100% 105% 107% 2022 September 75,768 100% 105% 2022 October 72,524 100% Weighted average 100% 104% 106% 107% 108% 109% 110% 111% 111% 110% 111% 111% 105% 106% The weighted average net revenue retention rate is in relation to the initial MRR or ARR added from each cohort. Net revenue retention is the most all-inclusive retention measure of a company's performance. It measures how much recurring revenue a cohort generates after a certain period relative to how much was initially acquired, taking into account all components of a cohort's recurring revenue, including retention, expansion, contraction, and churn. Using the analogy of a leaky bucket, if net revenue retention is 100% or greater, the company's revenue streams are not "leaking," meaning it would continue to have at least the same level of revenue even if it stopped acquiring new customers. If net revenue retention is less than 100%, the company is "leaking" and would continuously lose revenue unless it acquired new customers. A leaky bucket is not sustainable, so achieving net revenue retention of at least 100% is critical for sustainable performance. In the example, where the one-year average net revenue retention is over 100%, this tells us that the company's revenue is not leaky and can sustain its level of revenue over time. WHAT GREAT LOOKS LIKE ▪ >120% net revenue retention for enterprise clients, >100% net revenue retention for SMB clients ▪ Improving annualized retention over time (horizontal axis) ▪ Improving landing contract over time ▪ Improving upsell over time ▪ Retention is consistent across the cohort and not driven by a few power users

METRICS AND PERFORMANCE 11 CHAPTER 1 MEASUREMENTS ALTERNATIVE PRESENTATION METHODS (LINE GRAPH) Net Revenue Retention 140% 120% 100% 80% 60% 40% 12mth annualised: 109% 24mth annualised: 101% 20% 36mth annualised: 99% 0% 0 3 6 9 12 15 18 21 24 27 30 33 36 MAR-17 MAR-18 MAR-19 MAR-20 MAR-21 AVERAGE

METRICS AND PERFORMANCE 12 CHAPTER 1 MEASUREMENTS Growth and profitability Across a firm's development, it will have to balance profitability and growth. Many use the "Rule of 40" to determine this trade-off. The Rule of 40 states that the sum of a company's revenue growth and profitability should be greater than 40%. In other words, a company that grows 80% year-over-year but has a -40% cash flow margin should be valued equally to a company that experiences little to no revenue growth but generates 40% cash flow. Metric Description Formula Rule of 40 Rule of 40 is a measure of balance between growth and ARR growth + Free Cash profitability and by extension, sustainability of the business. Flow margin WHAT GREAT LOOKS LIKE ▪ Ideally >40% at all times RULE OF 40 CORRELATES WELL WITH THE MARKET VALUATION Companies Higher on the rule of 40% scale are generally valued higher by investors Market underperformers Market performers Market outperformers 20x U 18x SPT 16x PAYC NOW ASAN 14x NE M SHOP HUBS PLTR CWAN PCTY DT 12x LAW WK ESMT DSY XM enue PCOR v LEMON FIVN LVC COUP QLYS e SPSC BRZE 10x APPN CDAY DOUL TENB WDAY V / r APPF DV SUSE OLO LIME MIMEAVSTBLND SMCRT EXFY DOCU FROG FRSH 8x PING TEMN ESTCZENV USER CRM 2022 E MLNK APP QTWO RNG AMPL TWLO SPLK VTEX BIGC MSP SEMR PD AYX 6x WKL INTA PWSC ZM TMV FPIP AI EMIS NEWR ZUOEVBG BOX AVDX SNOW BASE WKME SAP BMBL WIX 4x LPSN DOTD FAA BLIND SUMO BNFT INFADBX UPLD EYE YEXT GHT RXT EGHT SINCH 2x BCOV TIETO TWOU WEAV ECOM ZENV SOW Rule of 40% line 0x 0.0% 10.0% 20.0% 30.0% 40.0% 50.0% 60.0% 70.0% Rule of 40% Source: GP Bullhound SaaS Index, Capital IQ (as of 30 June 2022)
METRICS AND PERFORMANCE 13 CHAPTER 1 MEASUREMENTS Unit economics In contrast to many traditional businesses, where full revenue and costs are recognized at the point of sale, in SaaS there is a mismatch between revenue recognized over time and costs recognized upfront. This timing difference makes it difficult to judge a company's health by simply looking at its income statement or gross margin, so a deeper understanding of unit economics is needed. Examining a company's growth on a unit level can help us understand if the growth is efficient and sustainable. At the highest level, the size of customer contracts indicates how much revenue the company can generate from a single customer. Companies with more enterprise sales typically have larger customer contracts than those that target SMBs and consumers. 01 Definitions of key contract-size metrics Metric Description Formula TCV Total Contract Value (TCV) the entire value of contract at point of sale over duration of contract, but excluding Total contract size unplanned upsell in the future. ACV Annual Contract Value (ACV) measures the value of a ARR customer contract over a 12-month period. For example, if # of customers the TCV is $2,000 over two years, the ACV would be $1,000. As the size of customer contracts varies between companies, the metrics most valuable to examine and understand a company’s unit economics and sales efficiency are those related to customer acquisition cost and lifetime value. 02 Definitions of key unit economic metrics Metric Description Formula CAC Customer Acquisition Cost (CAC) measures how much it costs the company to acquire a new customer. As there is a lag from when the acquisition costs are made to when the customer is acquired, CAC is often calculated S&M expenses in preceding period with the preceding period’s acquisition costs but with the current period’s number of # of new customers acquired customers acquired. in the current period CAC is best looked as fully-loaded, i.e. including the entire S&M and taking both direct costs (e.g. sales expenses) and indirect costs (e.g. brand marketing) into account.
14 CHAPTER 1 METRICS AND PERFORMANCE MEASUREMENTS Metric Description Formula CAC payback CAC Payback measures the time it takes for the revenues from acquired customers to CAC pay back the costs of acquiring them. The revenue is multiplied by gross margin to ARPA × gross margin account for the ongoing cost of providing the product. LTV Customer Lifetime Value (LTV) is the aggregated revenue an average customer expects to generate over their lifetime. Similar to CAC payback, the revenue is multiplied by the gross margin to account for [Landing contract + upsell] the ongoing cost of providing the product. × gross margin Note on average lifetime: ideally look at × average # of years lifetime actual churned customers to date from cohorts; otherwise use the actual contract length or in the worst case extrapolate from 12 month retention. LTV / CAC LTV/CAC shows how much revenue a customer generates over its lifetime relative LTV to the initial costs of acquiring it. If the ratio CAC is below 1, the company will never break even on the cost of acquiring the customer. Splitting unit economics into multiple buckets (SME, enterprise) and/or sales channels (direct sales, bottoms up) is tremendously useful to know where to invest and spend the effort. Example: Enterprise SaaS firms with free-tier may incorrectly show a too low blended unit economics as its being pushed down by low value free users. Once the free users are stripped out the unit economics often look fantastic. Or vice versa, the CAC may be artificially too low as it includes freemium users that found the business by themselves, yet generate hardly any actual revenue. LTV / CAC Example of LTV / CAC calculations Blended Human-assisted (High-touch) Self-serve (low-touch) ACV 2,750 ACV 4,036 ACV 1,391 (x) Gross Margin 85% (x) Gross Margin 85% (x) Gross Margin 85% Net ACV 2,343 Net ACV 3,439 Net ACV 1,185 (x) Lifetime 4.0 yrs (x) Lifetime 7.0 yrs (x) Lifetime 3.9 yrs (x) Upsell - (x) Upsell - (x) Upsell - LTV 9,319 LTV 24,073 LTV 4,677 (/) CAC 1,719 (/) CAC 4,102 (/) CAC 1,522 LTV / CAC 5.4x LTV / CAC 5.9x LTV / CAC 3.1x
METRICS AND PERFORMANCE 15 CHAPTER 1 MEASUREMENTS WHAT GREAT LOOKS LIKE ▪ CAC Payback Time: <12 month (i.e. CAC < ACV) for enterprises, <6 months for SMBs ▪ Lifetime: >5 years proven by customers and not extrapolated through cohorts ▪ LTV / CAC: >3.0x on blended basis Burn and capital efficiency To understand the capital efficiency of a company and when it needs to raise additional capital, the most telling metrics are those related to burn rate and runway. Metric Description Formula Gross burn Gross Burn is the total amount of cash the company Monthly cash outflows spends each month. Net burn Net Burn is the total amount of cash the company Monthly cash outflows - spends each month net the cash it generates. monthly cash inflows Runway Runway shows how many months the company will Cash balance be able to sustain its operations before running out of money. If the company operates with positive cash Net burn flows, the runway is infinite. Burn multiple Burn Multiple represents how much cash the company Net burn uses in order to generate incremental ARR. Net new ARR Monthly is just an example and such metrics are determined by the period the company chooses. WHAT GREAT LOOKS LIKE ▪ Ideally >18 month runway at all times with an easy option to extend to 24 month
METRICS AND PERFORMANCE 16 CHAPTER 1 MEASUREMENTS Debt metrics For venture debt investors, they will also examine the same SaaS metrics mentioned above, but with a greater emphasis on revenue stability. Additionally, debt providers will also delve into the balance sheet in greater detail: ▪ For liabilities, debt providers will be interested in understanding the nature of any existing loans, with questions such as: ▪ What other existing loans does the company have and to whom are they liable - to banks, other debt providers, suppliers? ▪ Is the loan secured? When does it mature? ▪ Are there significant payments due in the near term? ▪ Regarding assets, debt providers will want to know: ▪ What are the main assets of the business? What is the IP worth and who are potential buyers? ▪ Are there good receivables? (which impact retention metrics) ▪ Cash and cash runway In the case of raising venture debt, there are various metrics to consider on top of profitability and the aforementioned SaaS metrics when marketing one's company to venture debt investors. Metric Description Formula Total Debt Total debt to ARR is a measure of repayment ability of the Total debt to ARR borrower based on current loans undertaken; the lower the ARR ratio the better. Debt to Cash Debt to cash equity ratio is a measure of lending risk Debt facility amount equity ratio examined before a lender makes a loan, with higher ratios implying higher risk. Cash equity WHAT GREAT LOOKS LIKE ▪ Total debt to ARR ratio : 2x (in US), 1x (in Europe) ▪ Debt to cash equity ratio < 80%
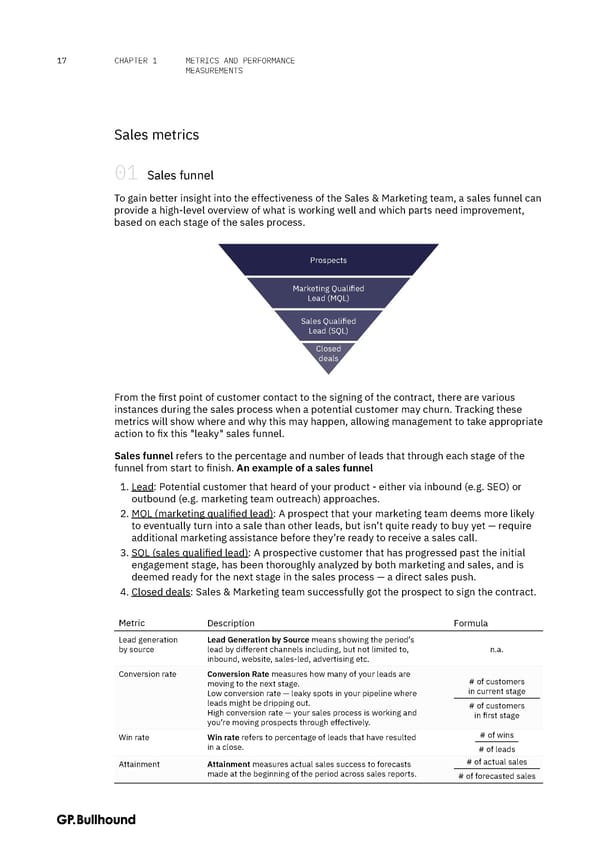
17 CHAPTER 1 METRICS AND PERFORMANCE MEASUREMENTS Sales metrics 01 Sales funnel To gain better insight into the effectiveness of the Sales & Marketing team, a sales funnel can provide a high-level overview of what is working well and which parts need improvement, based on each stage of the sales process. Prospects Marketing Qualified Lead (MQL) Sales Qualified Lead (SQL) Closed deals From the first point of customer contact to the signing of the contract, there are various instances during the sales process when a potential customer may churn. Tracking these metrics will show where and why this may happen, allowing management to take appropriate action to fix this "leaky" sales funnel. Sales funnel refers to the percentage and number of leads that through each stage of the funnel from start to finish. An example of a sales funnel 1. Lead: Potential customer that heard of your product - either via inbound (e.g. SEO) or outbound (e.g. marketing team outreach) approaches. 2. MQL (marketing qualified lead): A prospect that your marketing team deems more likely to eventually turn into a sale than other leads, but isn’t quite ready to buy yet — require additional marketing assistance before they’re ready to receive a sales call. 3. SQL (sales qualified lead): A prospective customer that has progressed past the initial engagement stage, has been thoroughly analyzed by both marketing and sales, and is deemed ready for the next stage in the sales process — a direct sales push. 4. Closed deals: Sales & Marketing team successfully got the prospect to sign the contract. Metric Description Formula Lead generation Lead Generation by Source means showing the period’s by source lead by different channels including, but not limited to, n.a. inbound, website, sales-led, advertising etc. Conversion rate Conversion Rate measures how many of your leads are # of customers moving to the next stage. in current stage Low conversion rate — leaky spots in your pipeline where leads might be dripping out. # of customers High conversion rate — your sales process is working and in first stage you’re moving prospects through effectively. Win rate Win rate refers to percentage of leads that have resulted # of wins in a close. # of leads Attainment Attainment measures actual sales success to forecasts # of actual sales made at the beginning of the period across sales reports. # of forecasted sales
METRICS AND PERFORMANCE 18 CHAPTER 1 MEASUREMENTS 02 Sales efficacy To understand the efficiency of the sales strategy and the productivity of the sales team, it might be useful to look at metrics related to sales efficiency. These metrics can help shine a light on whether the sales strategy is effective or not. Metric Description Formula Sales cycle Sales Cycle refers to time taken to sign a contract. Time from lead to close (usually depicted in months) Sales rep Sales Rep Performance is useful to show to understand performance each sales reps’ performance, both in terms of contracts n.a. signed and ACV, provides granular visibility of how the sales team is performing. Magic number Magic Number measures how much bang for the buck the ARR this period sales and marketing efforts have produced. Should match −ARR preceding period the sales cycle. Preceding period S&M WHAT GREAT LOOKS LIKE ▪ Magic number <0.50 = Suggests some areas need to be improved ▪ Magic number <0.75 = Decent ▪ Magic number >0.75 = Great
19 THE CFO HANDBOOK CHAPTER 2 FOR B2B SAAS Financial statements and reporting Pipeline reporting Reporting of forward-looking revenues The income statement The balance sheet
20 CHAPTER 2 FINANCIAL STATEMENTS AND REPORTING Pipeline reporting Pipeline reporting should closely follow the sales funnel to understand where the company is tracking in terms of revenue and ARR in the upcoming period. There are two ways to report the pipeline: on a weighted and unweighted basis. Metric Description Formula Unweighted Unweighted pipeline refers to the total value of all Total value of all contracts in pipeline contracts in the sales pipeline regardless what stage the sales funnel they are at. Weighted Weighted pipeline to the probability-weighted value of pipeline all contracts in the sales pipeline, where the probability is determined by the stage they are at in the funnel. E.g. if the tentative value of contract is €50,000 but the Probability − weighted value probability of close is only 50% then only €25,000 is of all contracts in the pipeline recognized in this metric. Weighted pipeline is more realistic estimate of the current pipeline over unweighted pipeline and as such should be favored. Pipeline Pipeline coverage refers to the amount of unweighted coverage pipeline needed to cover the target new ARR. Unweighted pipeline A pipeline coverage of 1x means that the company New ARR Required needs to close every deal in the pipeline to hit the quota for the period. WHAT GREAT LOOKS LIKE ▪ Usually a pipeline coverage of at least >3x is required Reporting of forward-looking revenues There are various forward-looking metrics used to understand future expected revenues. While not all of these metrics are within GAAP, they can still provide a representative picture of a company's future performance and are commonly reported by many software companies. Metric Description Bookings Bookings refers to the amount of revenue that is to be generated from contracts that have been signed with customers. Billings Billings refers to the amount of money that has been invoiced to customers. If the customer is paying in advance, billings can be made at the same time as bookings. ARR Annual Recurring Revenue (ARR) refers to the annualized recurring revenue the company generates from its customers on subscription contracts.
FINANCIAL STATEMENTS 21 CHAPTER 2 AND REPORTING Two other revenue-related metrics for software companies are deferred revenue and backlog, which together make up the Remaining Performance Obligation (RPO). RPO is becoming an increasingly widely-followed metric within the SaaS industry. Metric Description Deferred Deferred Revenue refers to the non-cancellable contractual obligation to deliver the revenue product for the period invoiced. Backlog Backlog refers to future non-cancellable contractual obligations. RPO Remaining Performance Obligation (RPO) is the sum of deferred revenue and backlog. RPO tells how much revenue the company is contractually expected to receive if it stopped all new sales today. cRPO Current Remaining Performance Obligation (cRPO) is the contractual revenue expected in next 12 months. The income statement The income statement describes a company's actual historical performance and is structured the same way for a software company as it is for any other company. However, the items included in each of the line items may differ for software companies when compared to more traditional businesses and business models. Line item Description Typical examples Revenue Also referred to as “top line” - COGS Cost of Goods Sold (COGS) refers ▪ Hosting costs (e.g., AWS) to all the direct costs related to ▪ API/data/software licenses and delivering the products. For a costs for operating the product software company, these are often such costs as hosting and software ▪ Transaction costs (e.g., Stripe) licenses required for the product to operate. However, if the case is that ▪ Human costs related to the company is not a pure software onboarding customers, including company, then it must also include all consulting, training, and human-related costs associated with implementation delivering the product capabilities. ▪ Human costs related to delivering the product, including DevOps for managing the servers and data centers and customer support Note on customer support: If customer support is seen as revenue generating e.g. directly linked to upsell or retention as is often the case with many usage-based models, then customer support should be in full in revenue. Customer support in operating expense signals it being a pure cost center.
FINANCIAL STATEMENTS 22 CHAPTER 2 AND REPORTING Line item Description Typical examples = Gross profit Also referred to as “Gross income” - S&M Sales and Marketing (S&M) refers to ▪ Salaries to the sales and all the costs and salaries related to marketing organization selling and marketing the product. ▪ Software licenses for tools used Everything from lead generation, within sales and marketing pipeline creation, sales, events, and software brand are included. ▪ Any costs related to brand, events, and similar - R&D Research and Development (R&D) ▪ Costs and salaries associated refers to all the costs and salaries with designing the product related to building and continuously ▪ Costs and salaries associated developing the products. Salary costs with developing and testing the for the company’s software developers product is therefore a typical such cost. As building a software product can be ▪ Costs and salaries associated seen as creating an asset, R&D costs with releasing and maintaining can in some instances be capitalized. the product However, if presenting a metric such as EBITDA or EBIT, or Net Income, the Note on R&D Capex: While it’s capitalized costs should most often be permitted to capitalize R&D it will added back since they are part of the artificially inflate bottom line and company’s regular operations. tends to be slightly frowned upon when the company is still in its growth phase - G&A General and Administrative (G&A) ▪ HR, finance, accounting, IT, and refers to all other costs and salaries legal costs and salaries related to the ongoing operations ▪ Software licenses for tools related of the company. G&A in a software to the operations of the above context is not much different from any functions other industry. ▪ All other general purpose costs = EBITDA Earnings Before Interest, Taxes, Depreciation, and Amortization - D&A Depreciation and Amortization (D&A) ▪ Hardware and other fixed assets refers to the writing down of tangible are depreciated and intangible assets over time. ▪ Capitalized R&D costs are Software is considered a tangible depreciated asset and is therefore depreciated and not amortized. ▪ Patents, trademarks, and other intangible assets are amortized = EBIT Earnings Before Interest and Taxes - Interest Interest expenses refers to the costs ▪ Interest costs on borrowed money related to the borrowing of money. ▪ Capital leases = EBT Earnings Before Taxes - Taxes Taxes refers to the taxes paid on any ▪ Taxes on positive earnings before positive EBT. The tax rate can vary by taxes region and country. = Net income Also referred to as “Net profit”, “Net earnings”, and “bottom line”.
FINANCIAL STATEMENTS 23 CHAPTER 2 AND REPORTING The balance sheet A SaaS company's balance sheet is often quite simple, consisting mostly of equity and working capital. While it includes many of the same line items as any other balance sheet, there are a few peculiarities that SaaS firms should be aware of, which are highlighted below. 01 Typical balance sheet items to highlight in SaaS Line item Description Typical examples Assets Intangible Goodwill, brand recognition and Capitalized R&D would flow here, if assets intellectual property, such as patents, such practice is used. trademarks, and copyrights as well as capitalized R&D expenses. Deferred tax Tax assets that reduces the company’s Most often arising from carryover of assets taxable income in the future arising losses. from carryover of losses. Accounts Revenue that has been recognized but Arises as customers use the product receivable not yet paid by the customer. but pay in arrears. Typical in monthly billing. Liabilities Deferred Revenue that’s been paid in cash, but Most often arises as customers prepay revenue not yet recognized as per performance contracts meaning it accrues in line obligation. with bookings. The balance is then released to income statement as costs in pro-rata over the months used. Typical in annual billing.
24 THE CFO HANDBOOK CHAPTER 3 FOR B2B SAAS Performance benchmarks Annual Recurring Revenue (ARR) growth YoY Gross Revenue Retention Net Revenue Retention CAC payback LTV/CAC Gross margin Free cash flow margin
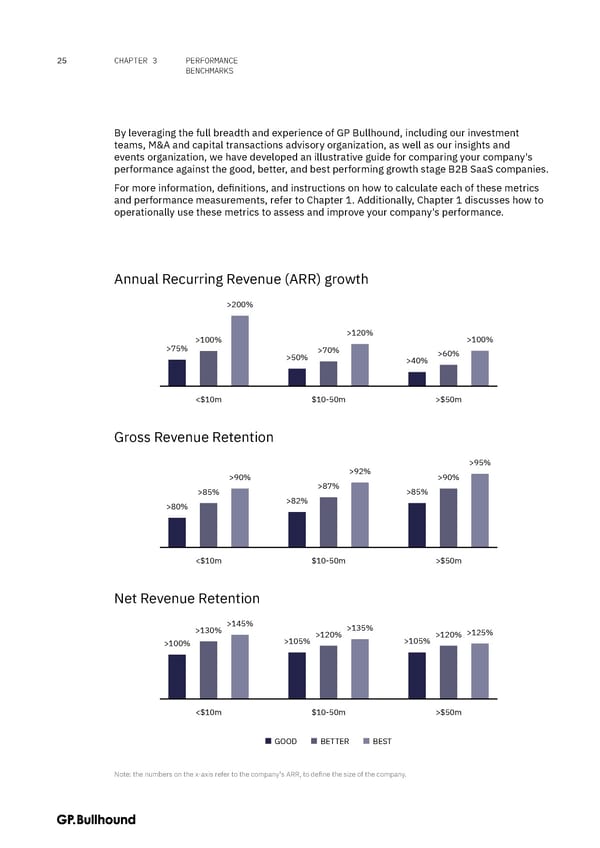
25 CHAPTER 3 PERFORMANCE BENCHMARKS By leveraging the full breadth and experience of GP Bullhound, including our investment teams, M&A and capital transactions advisory organization, as well as our insights and events organization, we have developed an illustrative guide for comparing your company's performance against the good, better, and best performing growth stage B2B SaaS companies. For more information, definitions, and instructions on how to calculate each of these metrics and performance measurements, refer to Chapter 1. Additionally, Chapter 1 discusses how to operationally use these metrics to assess and improve your company's performance. Annual Recurring Revenue (ARR) growth >200% >100% >120% >100% >75% >70% >60% >50% >40% <$10m $10-50m >$50m Gross Revenue Retention >95% >90% >92% >90% >85% >87% >85% >80% >82% <$10m $10-50m >$50m Net Revenue Retention >130% >145% >135% >120% >120% >125% >100% >105% >105% <$10m $10-50m >$50m GOOD BETTER BEST Note: the numbers on the x-axis refer to the company's ARR, to define the size of the company.
26 CHAPTER 3 PERFORMANCE BENCHMARKS CAC payback <3 yrs. <2.5 yrs. <2 yrs. <2 yrs. <2 yrs. <1.5 yrs. <1 yrs. <1 yrs. <1 yrs. <$10m $10-50m >$50m LTV/CAC >6.5x >5.0x >5.0x >3.5x >4.0x >3.5x >2.5x >3.0x >3.0x <$10m $10-50m >$50m Gross margin >85% >85% >85% >80% >80% >80% >75% >75% >75% <$10m $10-50m >$50m Free cash flow margin >0% >-25% >-25% >-50% >-50% >-50% >-100% >-100% >-200% <$10m $10-50m >$50m GOOD BETTER BEST

27 THE CFO HANDBOOK CHAPTER 4 FOR B2B SAAS Operational best practices The common traits of high-performing B2B SaaS finance teams High-performing finance teams use analytics to empower the entire organization with data-driven insights High-performing finance teams focus on efficient processes and a culture of knowledge sharing to effectively communicate insights High-performing finance teams use proven software tools that can be easily used, maintained, and supported for many years to come Effective organizations establish clear processes to ensure data is reliable Effective organizations focus on few but key metrics tied to core business performance Additional tips and tricks
28 CHAPTER 4 OPERATIONAL BEST PRACTICES Interviews with CFOs and finance teams from several of our portfolio companies have revealed a set of common traits among the highest-performing B2B SaaS finance teams. These traits, or “best practices”, are described below. THE EVOLVING ROLE OF THE CFO Previously, a CFO focuses on Today, CFO has much more to cover Financial reporting ementsBookkeeping Leadership Compliance Communicator, MinimumequirBudgeting business partner, cross- r departmental, influencer Operations Technology Technically competent, Adopting the right tech data analytics, profit CFO stack, selecting the right maximising tools and processes Strategy Controls Support C-Suite plan, Identify and mitigate evaluate lead indicators risks, forward-thinking, of business regulatory compliant

29 CHAPTER 4 OPERATIONAL BEST PRACTICES High-performing finance teams use analytics to empower the entire organization with data-driven insights All finance teams have the common responsibilities of accounting, reporting, budgeting, and so forth. However, high-performing B2B SaaS finance teams go beyond these traditional roles to take advantage of the vast amounts of data available to them. SaaS companies, with recurring revenues and software-driven products, have unique insights on how their company is evolving, how their product is used, and how efficient their organization is. For this reason, many successful B2B SaaS finance teams employ people dedicated to the analysis and utilization of this data. These roles may be part of the financial planning and analysis (FP&A) function, but they can also be separate and focused solely on data analysis. The people in these roles take data from across the organization and derive insights to benefit the entire organization. For example: ▪ They may use data from the sales team to compare unit economics and retention patterns across different characteristics (verticals, regions, sizes, etc.) to identify the best segments and define the ideal customer profile for the sales team to target. ▪ They may use data from the marketing team to determine which channels yield the best leads and customers, and optimize marketing spend thereafter. ▪ They may use data from the product team to figure out which usage characteristics lead to the best retention, and direct the product and customer success teams to focus on these usage patterns. By leveraging data and analytics, high-performing B2B SaaS organizations are able to optimize and improve their operations. This is why these organizations are structured to take full advantage of their data. FOR THE MODERN-DAY CFO, DATA IS THE NAME OF THE GAME - ANALYSING CROSS COMPANY INPUTS TO OBTAIN DATA-DRIVEN OUTPUTS Other departments Product Sales Finance Marketing Data Analytics Other departments
30 CHAPTER 4 OPERATIONAL BEST PRACTICES High-performing finance teams focus on efficient processes and a culture of knowledge sharing to effectively communicate insights While the process of deriving insights from data is important for a B2B SaaS organization, it is the effective communication of those insights to the rest of the organization that truly drives value. High-performing finance teams therefore actively try not to become siloed, and instead focus on creating efficient processes and a culture of knowledge sharing with sales, marketing, and the rest of the organization. Some examples of this include: ▪ Recurring monthly check-ins with sales leaders where people from the finance team communicate insights derived from sales data, to help ensure the sales team always targets the highest potential customers. ▪ Building a company culture of continuous and informal knowledge sharing, to help ensure that insights are not only shared monthly, but are acted upon as soon as they can be. Building such a culture is not exclusive to the finance team, but they can always try to be a role model to influence the rest of the organization for the better. Insights Open communication Business value

31 CHAPTER 4 OPERATIONAL BEST PRACTICES High-performing finance teams use proven software tools that can be easily used, maintained, and supported for many years to come CFOs and finance teams tend to be bogged down by a lot of repetitive tasks. Fortunately, in the present day, there are numerous workflow automation solutions that allow finance teams to be more efficient and focus on more value-added assignments. However, as the average organization now uses close to 100 different apps, many companies and finance teams have more tools than they can efficiently use. With an abundance of available tools and new ones being introduced every day, it can be tempting to choose the new and shiny ones without fully considering the team's operational capacity to efficiently use them in conjunction with their existing software suite. Therefore, a common trait among high-performing finance teams is that they commonly use tried-and-tested tools, such as standard ERP and CRM systems like SAP and Salesforce. While not the latest or most exciting, these tools have the following advantages: ▪ Long-term stability and reliability, as they have been supported for many years. ▪ Seamless integration with the organization's existing suite of tools. ▪ Best support for multiple currencies, taxes, and other regional differences. ▪ Ease of onboarding and faster training for new employees, as most people are already familiar with them.
32 CHAPTER 4 OPERATIONAL BEST PRACTICES CASE STUDY Excel is perhaps the most classic example of such software. Since it is well-known and understood by most people, employees can start using it immediately and deliver value to the organization. The files created in Excel can be easily shared with anyone in the organization or the broader industry, and everyone will be able to access its contents and insights. While insights in Excel can be more efficiently presented using a business intelligence or analytics platform, this requires continuous maintenance and integration with the organization's various tools and databases. If the organization has the capabilities and expertise to do this, the end results can be great. However, if it is done as a one-off effort or using an external consultant, it is at risk of falling apart. Thus, high-performing finance teams limit the number of tools they use and choose tried-and-tested tools that they know will be used, maintained, and supported for many years to come.
33 CHAPTER 4 OPERATIONAL BEST PRACTICES Effective organizations establish clear processes to ensure data is collected and stored in a reliable manner WHEN DATA INPUT IS INACCURATE AND UNORGANISED Bad data Unreliable output WHEN DATA INPUT IS RELIABLE AND COMPREHENSIVE Good data Reliable output There can be a lot of administrative work required from the employees to consistently and correctly use all the many tools a modern organization has. In sales, for example, if people have to input their sales progress into multiple tools, it is likely that none of the tools' data will be fully comprehensive or accurate. The reason being that salespeople may just want to get the administrative tasks done so they can focus on what they are actually employed to do, sales. Inaccurate data can render it unreliable and potentially worthless. To avoid this, effective organizations typically limit the number of tools they use and ensure that the tools they do use can be used efficiently and correctly. For example, in a sales system, they might make certain fields "required" and validate the data types of inputs. In addition, they establish clear processes and provide education on these processes to ensure that all employees, both new and experienced, know how to use the systems correctly. "The value of data lies in its reliability and comprehensiveness. A key hire for us was therefore a dedicated sales operations person that ensures that our systems are used correctly and consistently." However, administrative tasks are never easy to get right consistently. In these cases, many high-performing organizations hire a specific sales or revenue operations person who is responsible for ensuring that the systems are used correctly and that the data can be relied upon. For some organizations, this key hire can make the difference between data being worthless and data becoming a key driver of the organization's success.

34 CHAPTER 4 OPERATIONAL BEST PRACTICES Effective organizations focus operations on few but key metrics tied to core business performance Sales volume Sales cycle Logo retention Conversion rates Churn Your North ACV ARR Star Metric Run rate CAC payback Magic Number LTV/CAC Net retention Note: North star metric is defined to be a measurement that's most predictive of a company's long-term success. Information overload can be a common issue for SaaS companies when it comes to getting value from all of the metrics they track. While it is true that all metrics have a purpose and provide insight into the business, not all metrics are equally applicable or valuable for all parts of the organization. For example, the new sales team might not care as much about net retention figures as the customer success team, and the marketing team might not care as much about the number of tickets that have been closed in customer support. To address this issue, effective organizations limit the information and metrics that each individual needs to consider and care about. For example, some sales metrics might only need to be shared with sales leaders who can then strategize their team around those metrics. And for individual salespeople, only needing to focus on the number of seats sold as their guiding metric can help them stay focused on achieving that specific goal. Guiding an organization with only a few important metrics also makes performance much more easily comparable. This allows organizations to track how the sales team is performing on an individual basis, over time, and when targeting different customer groups or regions. "Focusing on too many metrics can be a distraction. It's therefore important to select a few key metrics that closely relate to the business's performance, so that everyone stays aligned with the company's goals. In our sales team, we found that tracking the number of seats sold was the most important metric for keeping us on track." Therefore, keeping it simple and choosing the right metric to guide the organization can be key to success. The best metric to use will vary from company to company, but it should be something that is closely tied to the core business performance. For sales teams, this could be something related to the volume of sales, such as the number of seats sold or the amount of revenue generated. For customer support teams, it could be something related to the number of tickets closed or customer satisfaction.
35 CHAPTER 4 OPERATIONAL BEST PRACTICES Additional tips and tricks Working as a CFO for a SaaS company can be challenging due to the constantly evolving demands of a startup environment and the unique operational practices and metrics specific to the software industry. Additionally, finance teams are often somewhat isolated from the rest of the organization, making it difficult to get the support they need. One solution is to join a startup CFO community, such as "Startup CFO". In these communities, CFOs can ask other CFOs questions about topics such as which tools to use, how to handle salary increases in an inflationary environment, and how to approach budgeting. THE IDEAL FINANCE TEAM SHOULD BE ANALYTICAL AND COLLABORATE ACROSS ALL DEPARTMENTS Iterative and agile feedback loops es Continously Analyses data c consolidates & & reports to aggregates data CRM HRIS ERP Adapts strategy & business plan Executives & Board ernal Data SourData Billings & Int Warehouse Spreadsheets Analyses performance Finance team Adapts S&M, Product & es (led by CFO) function/ other teams c department strategy Bank Suppliers Public Checks compliance ernal Data Sour Auditors, Regulators Reports to & Market Ext Partners Customers

36 THE CFO HANDBOOK CHAPTER 5 FOR B2B SAAS The finance software stack The core and traditional software stack Additions to the software stack for modern teams and workflows Example of a modern SaaS CFO’s software stack across various levels of company size and maturity
37 CHAPTER 5 THE FINANCE SOFTWARE STACK The software stack used by CFOs and their finance organizations may vary depending on the company's size, needs, and other factors. However, there are some core components that are commonly used by most companies. Furthermore, the rise of SaaS has led to the development of many specialized tools that help improve the efficiency of modern financial workflows. The core and traditional software stack ▪ Enterprise Resource Planning (ERP) systems: these systems provide a comprehensive overview of an organization's financial data, allowing users to manage and monitor key business processes such as accounting, procurement, and project management. ▪ Customer Relationship Management (CRM) systems: these systems enable businesses to manage their interactions with customers and potential customers, helping them to build and maintain strong relationships and improve customer satisfaction. ▪ Human Resource Information (HRIS) systems: these systems allow organizations to manage and track employee information such as payroll, benefits, and time off. HRIS systems can help streamline HR processes and improve efficiency. ▪ Billing systems: these systems help businesses to manage their invoicing and billing processes, allowing them to generate invoices, track payments, and manage customer accounts. Billing systems can help improve accuracy and speed up the billing process. Additions to the software stack for modern teams and workflows ▪ Spend management software tracks and manages non-payroll business expenses such as raw materials, services, and subscriptions. Some tools also offer software-enabled corporate cards for automatic expense management. ▪ Sales compensation software automates the accounting and administration of commissions and incentive plans based on customizable rules such as employee role, tenure, and sale type. ▪ Equity management software facilitates the administration of a company's equity and stock, also known as cap table management. ▪ Corporate performance management (CPM) and Financial planning and analysis (FP & A) software helps large companies monitor and manage the strategies that drive their business activities. It is used to create and implement processes and methodologies for tracking key performance indicators (KPIs). ▪ Analytics platforms or business intelligence (BI) software provide a set of tools for businesses to organize, analyze, and derive actionable insights from data to inform business strategy and improve decision-making. ▪ Data platforms process, transform, and ingest data to facilitate its consolidation and use for better decision-making. These platforms act as a central repository that integrates data from a wide range of internal and external sources.
38 CHAPTER 5 THE FINANCE SOFTWARE STACK Example of a modern SaaS CFO’s software stack across various levels of company size and maturity System Small companies Medium-size companies Large-size companies ERP systems CRM systems HRIS software Billing software Spend management software Sales compensation software Equity management software CPM and FP & A software Analytics platforms and BI software Data platforms
39 THE CFO HANDBOOK CHAPTER 6 FOR B2B SAAS Reporting templates P&L and summary financial review Revenue breakdown by product, geography, and customer SaaS key performance indicators (KPI) overview Annual Recurring Revenue (ARR) growth Sales pipeline Sales efficiency
40 CHAPTER 6 REPORTING TEMPLATES Reporting templates 01 P&L and summary financial review SUMMARY FINANCIAL REVIEW Illustrative Quarterly Profit & Loss example Q3 2022 Actual In $'000s Q3 2022 Q3 2021 YoY Growth Q2 2022 vs. last Qtr Q3 2022B vs. Budget Bookings 30,000 25,000 20% 28,000 7% 35,000 (14%) Revenue 15,000 18,000 (17%) 14,000 7% 17,000 (12%) (-) Cost of Goods Sold 5,000 6,000 4,000 4,000 Gross Profit 10,000 12,000 (17%) 10,000 - 13,000 (23%) % Gross Margin 67% 67% 71% 76% Operating Costs (-) Sales & Marketing 10,000 12,000 11,000 12,000 % of revenue 67% 67% 79% 71% (-) Research & Development 2,000 1,500 2,000 3,000 % of revenue 13% 8% 14% 18% (-) General & Administrative 500 200 200 200 % of revenue 3% 1% 1% 1% EBITDA (2,500) (1,700) (47%) (3,200) 22% (2,200) (14%) % EBITDA Margin -17% -9% (-) Depreciacion & Amortisation 900 900 1,300 1,300 EBIT (1,600) (800) (100%) (1,900) 16% (900) (78%) % EBIT Margin -11% -4% -14% -5% (-) Interest expense / (income) 900 700 500 1,200 EBT (700) (100) (600%) (1,400) 50% 300 (333%) (-) Tax 10 10 - 10 - 10 - Net income (710) (110) (545%) (1,410) 50% 290 (345%) % Net income Margin -5% -1% -10% 2% EBIT (1,600) (800) (1,900) (900) (-) Tax 10 10 10 10 (+) Depreciation & Amortisation 900 1,000 900 900 (+) Net change in Working Capital 1,240 1,490 2,190 2,000 (-) Capex 1,000 2,000 2,000 1,500 Unlevered Free cash flow (470) (320) (47%) (820) 43% 490 (196%) Starting cash 50,000 10,000 50,000 (+) Net change in cash (470) (320) (47%) (820) 43% 490 (196%) Ending cash 45,250 4,800 43,600
41 CHAPTER 6 REPORTING TEMPLATES WHAT TO DISCUSS ▪ Discuss the metrics in this quarter; include growth and comparison to budget. ▪ Discuss which items grew significantly and why. ▪ Discuss which items exceeded budget significantly and why. ▪ Were there any significant one-offs? Any financing events? What about capex? REVENUE ▪ Behind plan on Revenue, EBITDA & Cash Flow due to slower growth in bookings from existing customers, -17% YoY growth in Q3. ▪ $18m Rev in Q3 '21, fell to $15m in Q3 '22. ▪ 52% Content / Core; 32% Coupon; Remainder Reporting and Other. ▪ Focus is growing content publishers. This is growing faster than Coupon & Other US 65%; UK 15%, APAC 10%. ▪ Predictable perfomance revenue, other than seasonality. Q4 ~1/3 of annual revenues. ▪ 60% of sales from customers signed prior to 2020. EXPENSES ▪ Just over $12.5m total expenses; 73% employee related, 10% infrastructure, 5% Dev. ▪ 78 employees. ▪ EBITDA of $3.2m in 2021, expected to grow to $3.5m in 2022 and $4.5m in 2023. ▪ Potential synergies on staff and real estate.
42 CHAPTER 6 REPORTING TEMPLATES 02 Revenue breakdown by product, geography, and customer PRODUCT INCREASING IN POPULARITY, WITH US PROVIDING MOST REVENUE REVENUE ANALYSIS - BY TOP 10 CLIENTS REVENUE ANALYSIS - BY GEOGRAPHY 2022 YTD 2022 YTD 1% 1% Illustrative 0% 2%4% 1% 6% example 5% 2% 2% 4% 7% 4% 5% 60% 11% 70% 7% 8% COMPANY A COMPANY B COMPANY C US UK FRANCE COMPANY D COMPANY E COMPANY F CHINA SWITZERLAND COMPANY G COMPANY H COMPANY I CANADA SINGAPORE OTHER COMPANY J OTHERS Q3 2022 Actual Q3 2022 Actual In $'000s $ % YoY % vs. Budget In $'000s $ % YoY % vs. Budget Company A 2 29% (80%) (96%) US 70 70% 133% (9%) Company B 43 43% 258% (16%) UK 11 11% (66%) (89%) Company C 29 29% 123% (43%) France 7 7% (85%) (81%) Company D 10 10% (29%) (80%) China 2 2% (97%) (95%) - - - - - Switzerland 2 2% (97%) (83%) Canada 1 1% (98%) (98%) Singapore 1 1% (99%) (97%) Other 6 6% 500% (93%) WHAT TO DISCUSS ▪ Breakdown down sources of revenue into segments - by region/geography, customer type, sources, etc. ▪ Analysis should be done in a way that is most relevant and accurate to represent the business.

REPORTING 43 CHAPTER 6 TEMPLATES EXAMPLE DISCUSSION ▪ Top 10 client for Q3 '22 contributed 40% of total revenue. ▪ Aligns with new sales strategy to target more SMBs, moving away from large contracts. ▪ US is the strongest performing region, contributing to 60% of revenues. ▪ Supports shift in target customer 2 years ago as company expands presence in US. ▪ Strong revenue growth in Q3 '22 ensure company is on track for FY2022, with 20% of budget left to chase in Q4 '22. 03 SaaS key performance indicators (KPI) overview KEY PERFORMANCE INDICATORS IN SAAS Illustrative Example of KPI reporting example Quarterly KPIs Q3 2022 Actual In $'000s Q3 2022 Q3 2021 YoY Growth Q2 2022 vs. last Qtr Q3 2022B vs. Budget ARR (BOP) 15,000 13,000 15% 14,000 7% 14,500 3% (+) New Business 5,000 4,500 11% 4,500 11% 7,500 (33%) (+) Upsell 1,500 3,000 (50%) 1,000 50% 3,000 (50%) (+) Resurrected - - - - - - - (-) Contraction 250 200 25% 200 25% 300 (17%) (-) Churn 450 900 (50%) 900 (50%) 900 (50%) ARR (EOP) 20,800 19,400 7% 18,400 13% 23,800 (13%) 12 Month Retention rates Gross Revenue Retention 105% 108% 108% 108% Net Revenue Retention 138% 143% 140% 160% Customer / Logo Retention 94% 60% 91% 96% Sales Effectiveness S&M 10,000 12,000 (17%) 11,000 (9%) 12,000 (17%) ACV 73 216 (66%) 74 (1%) 87 (16%) Revenue Per Account 400 380 5% 350 14% 480 (17%) Magic number 5.8 3.8 53% 3.5 66% 4.0 # Customers # of Customers BOP 250 100 150% 225 11% 250 - Customers Churned (15) (40) (63%) (20) (25%) (10) 50% New Customers 50 30 67% 45 11% 35 43% # of Customers EOP 285 90 217% 250 14% 275 4%
44 CHAPTER 6 REPORTING TEMPLATES Illustrative example Q3 2022 Actual In $'000s Q3 2022 Q3 2021 YoY Growth Q2 2022 vs. last Qtr Q3 2022B vs. Budget Growth and Expansion Gross Margin % 67% 67% 67% 71% CAC 200 400 ($200) 244 ($0) 343 ($143) Average lifetime 10 7 7 $0 7 LTV 487 1,006 ($519) 343 $0 433 $54 LTV / CAC 2.4x 2.5x (0.1x) 1.4x +0.7x 1.3x +1.2x CAC Payback Period (months) 2.3 mo. 2.4 mo. (0.1 mo.) 3.0 mo. (0.2 mo.) 1.6 mo. 0.7 mo. Capital Efficiency Net monthly burn (157) (140) (140) 297 End of period cash balance 5,080 4,500 5,500 5,000 Runway 32.4 mo. 32.1 mo. 39.3 mo. Profitable WHAT TO DISCUSS ▪ High level on what went well and what didn’t work. ▪ Deeper analysis done on the following pages. WORKING ▪ Recurring ARR will surpass 50% in Q4; up from 30% at beginning of 2022. ▪ Dollar retention rates 100% or greater for three straight quarters. ▪ Executive team is in place and driving the business. ▪ Adding customers such as [•], [•] and [•]. ▪ Finalizing 3 year contract with [•]. ▪ Discussions with potential investors [•] and [•]. NOT WORKING ▪ $1m in New Bookings, well short of budget. ▪ Terminated 4 out of 6 US sales executives. ▪ H2 revenue forecasted below budget. ▪ Asia revenue lower than expected due to companies being cautious given political climate.
45 CHAPTER 6 REPORTING TEMPLATES 04 Annual Recurring Revenue (ARR) growth ARR GROWING 40% YOY DRIVEN BY LARGE WINS Illustrative Example ARR table example Q3 2022 Actual In $'000s Q3 2022 Q3 2021 YoY Growth Q2 2022 vs. last Qtr Q3 2022B vs. Budget ARR (BOP) 15,000 13,000 15% 14,000 7% 14,500 3% (+) New Business 5,000 4,500 11% 4,500 11% 7,500 (33%) (+) Upsell 1,500 3,000 (50%) 1,000 50% 3,000 (50%) (+) Resurrected - - - - - - - (-) Contraction 250 200 25% 200 25% 300 (17%) (-) Churn 450 900 (50%) 900 (50%) 900 (50%) ARR (EOP) 20,800 19,400 7% 18,400 13% 23,800 (13%) Key wins and upsell Region Deal Sales Rep Q3 ACV AMR Company X Mr. X $60,000 Company Y Mrs. Y $66,000 Company X Mr. X $82,000 Company Y Mrs. Y $30,000 AMR Total $238,000 EMEA Company X Mr. X $39,000 Company Y Mrs. Y $32,000 Company X Mr. X $84,000 Company Y Mrs. Y $20,000 Company X Mr. X $86,000 Company Y Mrs. Y $55,000 Company X Mr. X $26,000 EMEA Total $342,000 WHAT TO DISCUSS ▪ Talk about ARR development vs. last quarter, vs. last year and vs. budget. ▪ Talk about where the new ARR is coming from; Discuss if any really significant and big wins; Discuss what has worked and hasn’t worked. ▪ Talk about upsell ARR development: Which client is especially buying more? What product and why? Talk about what is making it work. ▪ Talk about variance across geographies, if relevant.
REPORTING 46 CHAPTER 6 TEMPLATES EXAMPLE DISCUSSION ▪ ARR grew 30% QoQ to $15m; Up from $5m from year earlier and exceeding budget by $1M (+10% budget). ▪ Recurring ARR will surpass 50% once [•] signs. ▪ New land and expand strategy proving to be a success; Upsell up 30% QoQ; Acquiring internal champions key and new customer success team of 10 helping. ▪ Adding leading brands: [•], [•] and [•]. ▪ Variance on Key Deals: 60% of global variance in Asia; Japan variance of ~$800K or 40% of global variance. ▪ Q4 AMR: Risk related with [•] introduced un-scoped requirements on managing creative in platform. ▪ EMEA variance across a handful of smaller deals in Q2, largest being [•]. Illustrative 05 Sales pipeline example SALES FUNNEL SHOWS 8% WIN RATE, INCREASING AS SALES TEAM RAMPS UP AND BACKED BY STRONG PIPELINE Sales Funnel Example Q3 2022 Actual In $'000s Q3 2022 Q3 2021 YoY Growth Q2 2022 vs. last Qtr Q3 2022B vs. Budget Sales funnel Prospects 1,000 200 400% 800 25% 900 11% MQL 800 150 433% 600 33% 700 14% SQL 520 100 420% 400 30% 500 4% Closed deals 78 10 680% 50 56% 80 -3% Win rate 8% 5% 3% 6% 2% 9% -1% Sales pipeline ACV Setup Probability Pipeline Sources Account Name (USD) fee (%) Close Date Status Region [Customer Name] Company Inc. 42,000 5,000 90% 31/12/2022 Carryover AMR Program 2022- AMR Partnerships (NL, Company 2 Inc. 47,220 3,370 90% 03/10/2022 Commit EMEA DE, FR & UK) (all products) 2022 BigBucks Ltd. 103,000 0 90% 04/10/2022 Commit EMEA SaaS EMEA 2022 Affiliates Firm 1 GmbH 42,667 1,300 90% 31/10/2022 Carryover EMEA Global
47 CHAPTER 6 REPORTING TEMPLATES ACV Setup Probability Pipeline Sources Account Name (USD) fee (%) Close Date Status Region Services Firm 2 UK 60,000 90% 31/10/2022 Commit EMEA SMB Network Company 3 Inc. 0 90% 04/10/2022 Commit EMEA GmbH- Sweden AB 52,800 2,750 90% 30/10/2022 Carryover EMEA Affiliates DE – 2022 Network Finland Oy 61,200 5,700 90% 05/10/2022 Carryover EMEA Asia – 2022 UK Ltd. 90,000 10,000 90% 08/11/2022 Commit JAPAC 2022 - Affiliate Firm 3 AU 40,000 10,000 90% 15/10/2022 Carryover JAPAC Platform 2022 - Firm 4 60,000 2,500 90% 14/10/2022 Carryover JAPAC Global Affiliate Channel Affiliate Foundation X 72,000 5,000 90% 31/10/2022 Carryover AMR Program-2022- AMR Upsell SaaS Association Y 60,000 80% 07/10/2022 Carryover AMR convert AMR Partner program Firm 5 110,000 10,000 80% 31/12/2022 Carryover AMR – Robert Affiliate Company 5 Inc. 84,996 10,000 80% 31/12/2022 Commit AMR Program 2022 – AMR WHAT TO DISCUSS ▪ Discuss high level sales funnel. ▪ Talk about pipeline for next quarter and if any visibility for rest of the year. Discuss if key deals are being pushed to next quarter. ▪ Does the pipeline support the budget? ▪ Discuss regional differences. ▪ Discuss anything else pipeline related (new practices, systems in place). EXAMPLE DISCUSSION ▪ In Q3, marketing team received 1,500 prospects (+15% YoY). ▪ 60% were inbound, 40% were outbound, in line with higher SEO spend. ▪ 80% of prospects turned in MQL because of active follow ups. ▪ 65% of MQL turned into SQL since quality of leads were robust and many customers were interested in our new features. ▪ 15% of SQL were successfully closed – half of sales team were new hires, not fully ramped up.
48 CHAPTER 6 REPORTING TEMPLATES ▪ Key wins such as [•] and [•] worth $200K ACV each are moving through pipeline ensuring Q3 will have very high likelihood of hitting targets. ▪ Comfortable pipeline in EMEA; Americas lagging behind due to re-established sales team still finding traction. ▪ Overall probability weighted pipeline for c. $2.1m vs. target $2.5m. 06 Sales efficiency MORE CUSTOMERS ONBOARDED IN Q3 WITH HIGHER ACV Illustrative Quarterly Sales Efficacy example Friday, September 30, 2022 Summary Q3 2022 Average deal size (in $) Sales cycle (in months) Customer Classification Region Segment (annual rev) Actuals Target % Target % QoQ % YoY Actuals Target % Target % QoQ % YoY EMEA Small <$10m 26,500 25,000 6% -2% 3% 2.3 3.0 -23% -5% -9% EMEA Mid-size $10-100m 68,750 75,000 -8% 2% 5% 4.2 4.0 5% 5% 3% EMEA Enterprise >$100m 189,000 150,000 26% 5% 8% 6.5 6.0 8% -5% -3% # of Deals closed Customer Classification Region Segment (annual rev) Q2 2020 Q3 2020 Q4 2020 Q1 2021 Q2 2021 Q3 2021 Q4 2021 Q1 2022 Q2 2022 Q3 2020 EMEA Small <$10m 133 172 133 131 168 152 199 135 104 142 EMEA Mid-size $10-100m 87 92 75 85 94 68 98 62 57 94 EMEA Enterprise >$100m 38 57 38 33 52 56 52 56 52 37 Total 258 321 246 249 314 276 349 253 213 273 Deal pipeline Q3 2022 Dealflow sources Customer Classification % MQL % SQL % win Region Segment (annual rev) Inbound Outbound Total MQL conversion SQL conversion Closed rate EMEA Small <$10m 662 351 1013 369 36% 257 25% 142 14% EMEA Mid-size $10-100m 695 639 1334 286 21% 154 12% 94 7% EMEA Enterprise >$100m 489 408 897 196 22% 108 12% 37 4%
REPORTING 49 CHAPTER 6 TEMPLATES Attainment Q3 2022 Sales rep # of Deals closed Total deal value ($) Ramped Quota Actual % Attained Quota Actual % Attained EMEA SMB Rep 1 100% 50 48 96% 50,000 49,000 98% EMEA SMB Rep 2 50% 50 34 68% 50,000 25,000 50% EMEA SMB Rep 3 25% 50 12 24% 50,000 13,000 26% EMEA SMB Rep 4 100% 50 60 120% 50,000 65,000 130% EMEA SMB Rep 5 100% 50 90 180% 50,000 70,000 140% EMEA Enterprise Rep 1 75% 25 21 84% 150,000 140,000 93% EMEA Enterprise Rep 2 50% 25 16 64% 150,000 90,000 60% EMEA Enterprise Rep 3 100% 25 30 120% 150,000 175,000 117% WHAT TO DISCUSS ▪ Discuss sales and sales organisation; Are there any updates that reflect in numbers, or will be reflected in the numbers in the near future? ▪ How have the contract values developed for new clients? ▪ Particularly strong in selling any specific product? ▪ How much was spent on marketing? What is the acquisition cost? EXAMPLE DISCUSSION ▪ Q3 Objectives: Open, qualify and advance pipeline. ▪ Search underway for New Head of US Sales. ▪ Regional Sales Lead ([•]) on boarded in New York; He will lead East Coast Sales Team. ▪ [•] will return to Australia to run JAPAC effective April 1, 2023; He will replace [•] who will leave the Company as of March 31st. ▪ [•] has significant commission potential for delivering results in Q1. ▪ [•] will provide support to [•] while we recruit new head of US Sales. ▪ Actively recruiting sales reps in US & APAC to replace five departed reps (4 non regrettable, 1 regrettable). ▪ Expanded use of Salesforce to improve tracking of pipeline for current quarter and Pipeline creation for following quarters.
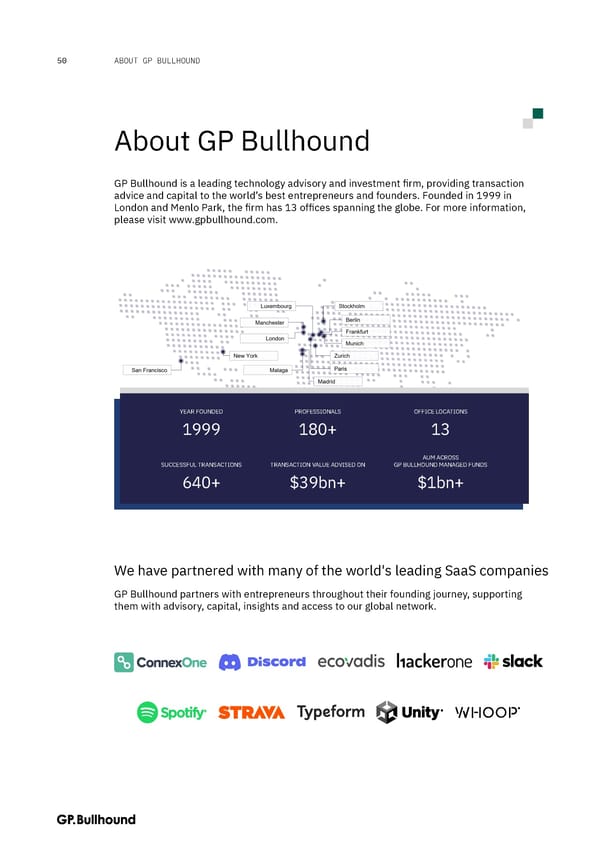
50 ABOUT GP BULLHOUND About GP Bullhound GP Bullhound is a leading technology advisory and investment firm, providing transaction advice and capital to the world’s best entrepreneurs and founders. Founded in 1999 in London and Menlo Park, the firm has 13 offices spanning the globe. For more information, please visit www.gpbullhound.com. YEAR FOUNDED PROFESSIONALS OFFICE LOCATIONS 1999 180+ 13 AUM ACROSS SUCCESSFUL TRANSACTIONS TRANSACTION VALUE ADVISED ON GP BULLHOUND MANAGED FUNDS 640+ $39bn+ $1bn+ We have partnered with many of the world's leading SaaS companies GP Bullhound partners with entrepreneurs throughout their founding journey, supporting them with advisory, capital, insights and access to our global network.
51 Disclaimer The contents of this document (hereinafter referred to as the "Presentation") shall not be deemed to be any form of offer or binding commitment on the part of GP Bullhound Asset Management Ltd (“GP Bullhound”). This Presentation is provided for use by the intended recipient for information purposes only. It is prepared on the basis that the recipients are sophisticated investors (defined as “professional clients” in Annex II of Directive 2014/65/EU on markets in financial instruments), with a high degree of financial sophistication and knowledge. This Presentation and its contents are not intended for and must not be used or relied upon by private or retail investors in the UK or any other jurisdiction where access, use, reliance upon, or availability of this Presentation would be unlawful. No representation or warranty, express or implied, is or will be made in respect of the information contained in this Presentation and no responsibility or liability is or will be accepted by GP Bullhound , its “Affiliates” (meaning any entity that owns or controls, is owned or controlled by or is under common control or ownership with GP Bullhound), or its “Associates” (meaning in relation to an undertaking, its officers, directors, members and employees from time to time, any Affiliates and the officers, directors, members and employees from time to time of any Affiliates), and its agents in this regard. In particular, but without prejudice to the generality of the foregoing, no representation or warranty is given as to the accuracy, completeness or reasonableness of any projections, targets, estimates or forecasts contained in this Presentation or in such other written or oral information that may be provided by GP Bullhound from time to time. The information contained in this Presentation has been prepared by GP Bullhound in good faith, but it has not been verified by an independent third party. All liability is expressly excluded to the fullest extent permitted by law. This Presentation may contain forward-looking statements, which involve risks and uncertainties. Actual results may differ significantly from the results described in such forward-looking statements. Forward-looking information is provided for illustrative purposes only and is not intended to serve as, and must not be relied upon as a guarantee, assurance, prediction or a definitive statement of fact or probability. Actual events and circumstances are difficult or impossible to predict and may differ from any assumptions contained within the Presentation. Any past performance information contained in this Presentation is provided for illustrative purposes only and is not necessarily a guide to future performance and the value of securities may fall as well as rise. In particular, investments in the technology sector can involve a high degree of risk and investors may not get back the full amount invested. This Presentation should not be construed in any circumstances as a solicitation or offer, or recommendation, to acquire or dispose of any investment or to engage in any other transaction, or to provide any investment advice or service and you should not act or refrain from acting upon any information contained in it without seeking appropriate professional advice. In the event that you should wish to engage GP Bullhound, separate documentation including offering documents, marketing materials and other information about our financial products will be provided to you in due course. For the purposes of the rules and guidance issued by the Financial Conduct Authority ("FCA"), this Presentation has been communicated by GP Bullhound, which is authorised and regulated by the FCA in the United Kingdom under number 647003.This Presentation is only directed at professional clients (as defined above) and in the rules and guidance issued by the FCA from time to time, and any investment or investment activity to which this Presentation relates is available only to such professional clients and GP Bullhound will engage only with such persons. The information contained in this Presentation must not be made available to, accessed, used by, or relied upon by persons who are not professional clients and any person who is not a professional client should return it immediately to GP Bullhound at the address below and permanently erase any copy which is in its possession. This Presentation and any other information or opinions supplied or given to you by GP Bullhound constitute confidential information. Neither the whole nor any part of the information contained in this Presentation may be duplicated in any form or by any means. Neither should the information contained in this Presentation, or any part thereof, be redistributed or disclosed to any third party without the prior written consent of GP Bullhound. GP Bullhound is a private limited company registered in England and Wales, company number 08869750, and is authorised and regulated by the FCA. Any reference to a partner in relation to GP Bullhound is to a member of GP Bullhound or an employee with equivalent standing and qualifications. A list of the members of GP Bullhound is available for inspection at its registered office: 78 St. James's Street, London, England, SW1A 1JB
LONDON SAN FRANCISCO STOCKHOLM tel. +44 207 101 7560 tel. +1 415 986 0191 tel. +46 8 545 074 14 78 St Jame’s Street One Sansome Street, Suite 3650 Grev Turegatan 30 London SW1A 1JB San Francisco, CA 94104 114 38 Stockholm United Kingdom United States Sweden BERLIN MANCHESTER PARIS tel. +49 30 610 80 6019 tel. +44 161 416 5031 tel. +33 1 82 88 43 40 Kleine Jaegerstr. 8 ABC Buildings, 21-23 Quay St, 9th Floor 39 Avenue Franklin Delano Roosevelt 10117 Berlin Manchester M3 4AE 75008 Paris Germany United Kingdom France MADRID NEW YORK LUXEMBOURG tel. +34 916 226 917 tel. +1 212 759 1870 tel. +352 621 653 191 Paseo de Recoletos 6, 7º Oficina 1 489 Fifth Avenue, 34th PH 33 Boulevard Prince Henri 28001 Madrid New York, NY 10017 1724 Luxembourg Spain United States Luxembourg ZURICH MALAGA MUNICH Othmarstrasse 8 tel. +34 680 72 64 24 tel. +49 151 1714 1045 8008 Zurich Calle Martinez, 11, 2º Brienner Strasse 41 Switzerland 29005 Malaga 80333 Munich Spain Germany FRANKFURT tel. +49 152 0236 7485 Oper46, Bockenheimer Anlage 46 60322 Frankfurt am Main Germany Register to receive news, Insights reports & events invitations from GP Bullhound This report is intended for professional investors only; see the back of the report for important disclosures. GP Bullhound Corporate Finance Ltd and GP Bullhound Asset Management Limited are authorised and regulated by the Financial Conduct Authority GP Bullhound Inc is a member of FINRA GP Bullhound Luxembourg S.à.r.l. is regulated by the CSSF in Luxembourg Subscribe to receive GP Bullhound Insights and News on www.gpbullhound.com/subscribe/