
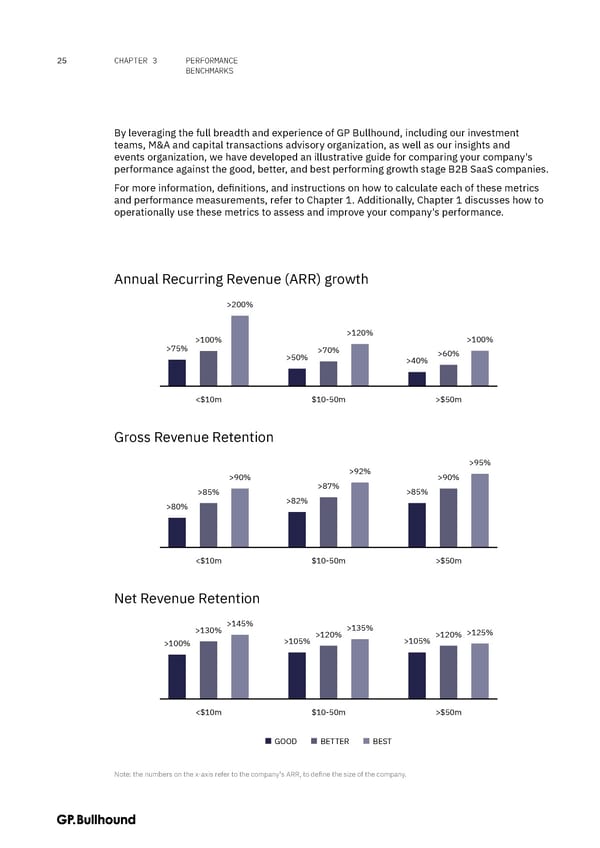
25 CHAPTER 3 PERFORMANCE BENCHMARKS By leveraging the full breadth and experience of GP Bullhound, including our investment teams, M&A and capital transactions advisory organization, as well as our insights and events organization, we have developed an illustrative guide for comparing your company's performance against the good, better, and best performing growth stage B2B SaaS companies. For more information, definitions, and instructions on how to calculate each of these metrics and performance measurements, refer to Chapter 1. Additionally, Chapter 1 discusses how to operationally use these metrics to assess and improve your company's performance. Annual Recurring Revenue (ARR) growth >200% >100% >120% >100% >75% >70% >60% >50% >40% <$10m $10-50m >$50m Gross Revenue Retention >95% >90% >92% >90% >85% >87% >85% >80% >82% <$10m $10-50m >$50m Net Revenue Retention >130% >145% >135% >120% >120% >125% >100% >105% >105% <$10m $10-50m >$50m GOOD BETTER BEST Note: the numbers on the x-axis refer to the company's ARR, to define the size of the company.
 The CFO Handbook | GP Bullhound Page 24 Page 26