
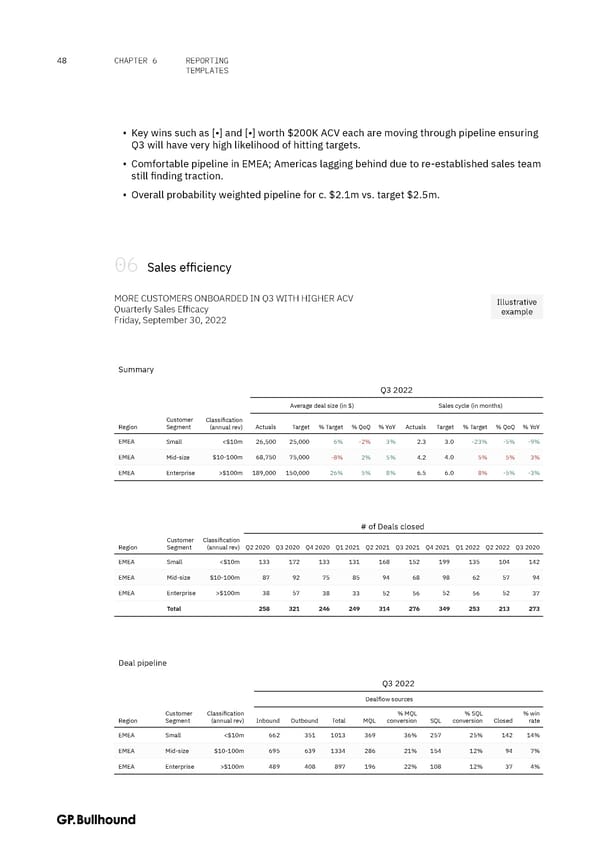
48 CHAPTER 6 REPORTING TEMPLATES ▪ Key wins such as [•] and [•] worth $200K ACV each are moving through pipeline ensuring Q3 will have very high likelihood of hitting targets. ▪ Comfortable pipeline in EMEA; Americas lagging behind due to re-established sales team still finding traction. ▪ Overall probability weighted pipeline for c. $2.1m vs. target $2.5m. 06 Sales efficiency MORE CUSTOMERS ONBOARDED IN Q3 WITH HIGHER ACV Illustrative Quarterly Sales Efficacy example Friday, September 30, 2022 Summary Q3 2022 Average deal size (in $) Sales cycle (in months) Customer Classification Region Segment (annual rev) Actuals Target % Target % QoQ % YoY Actuals Target % Target % QoQ % YoY EMEA Small <$10m 26,500 25,000 6% -2% 3% 2.3 3.0 -23% -5% -9% EMEA Mid-size $10-100m 68,750 75,000 -8% 2% 5% 4.2 4.0 5% 5% 3% EMEA Enterprise >$100m 189,000 150,000 26% 5% 8% 6.5 6.0 8% -5% -3% # of Deals closed Customer Classification Region Segment (annual rev) Q2 2020 Q3 2020 Q4 2020 Q1 2021 Q2 2021 Q3 2021 Q4 2021 Q1 2022 Q2 2022 Q3 2020 EMEA Small <$10m 133 172 133 131 168 152 199 135 104 142 EMEA Mid-size $10-100m 87 92 75 85 94 68 98 62 57 94 EMEA Enterprise >$100m 38 57 38 33 52 56 52 56 52 37 Total 258 321 246 249 314 276 349 253 213 273 Deal pipeline Q3 2022 Dealflow sources Customer Classification % MQL % SQL % win Region Segment (annual rev) Inbound Outbound Total MQL conversion SQL conversion Closed rate EMEA Small <$10m 662 351 1013 369 36% 257 25% 142 14% EMEA Mid-size $10-100m 695 639 1334 286 21% 154 12% 94 7% EMEA Enterprise >$100m 489 408 897 196 22% 108 12% 37 4%
 The CFO Handbook | GP Bullhound Page 47 Page 49