
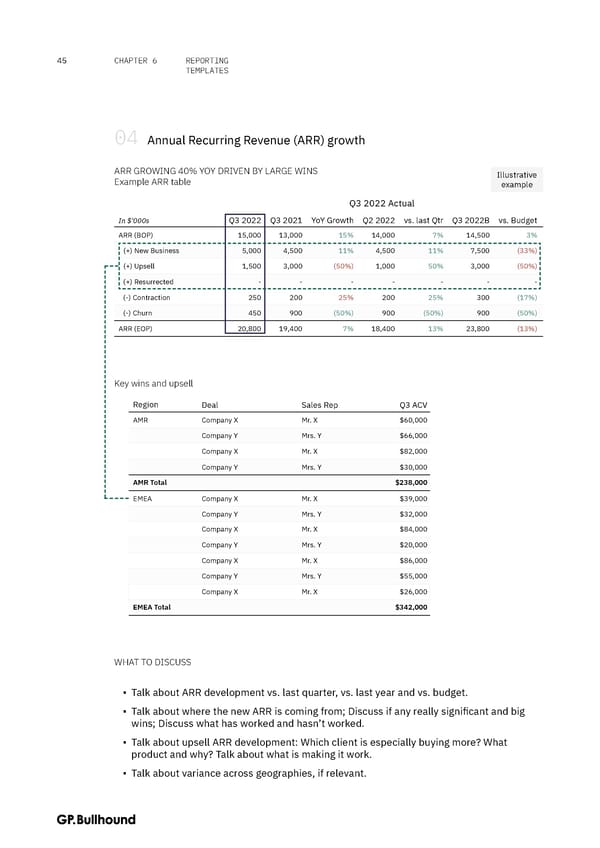
45 CHAPTER 6 REPORTING TEMPLATES 04 Annual Recurring Revenue (ARR) growth ARR GROWING 40% YOY DRIVEN BY LARGE WINS Illustrative Example ARR table example Q3 2022 Actual In $'000s Q3 2022 Q3 2021 YoY Growth Q2 2022 vs. last Qtr Q3 2022B vs. Budget ARR (BOP) 15,000 13,000 15% 14,000 7% 14,500 3% (+) New Business 5,000 4,500 11% 4,500 11% 7,500 (33%) (+) Upsell 1,500 3,000 (50%) 1,000 50% 3,000 (50%) (+) Resurrected - - - - - - - (-) Contraction 250 200 25% 200 25% 300 (17%) (-) Churn 450 900 (50%) 900 (50%) 900 (50%) ARR (EOP) 20,800 19,400 7% 18,400 13% 23,800 (13%) Key wins and upsell Region Deal Sales Rep Q3 ACV AMR Company X Mr. X $60,000 Company Y Mrs. Y $66,000 Company X Mr. X $82,000 Company Y Mrs. Y $30,000 AMR Total $238,000 EMEA Company X Mr. X $39,000 Company Y Mrs. Y $32,000 Company X Mr. X $84,000 Company Y Mrs. Y $20,000 Company X Mr. X $86,000 Company Y Mrs. Y $55,000 Company X Mr. X $26,000 EMEA Total $342,000 WHAT TO DISCUSS ▪ Talk about ARR development vs. last quarter, vs. last year and vs. budget. ▪ Talk about where the new ARR is coming from; Discuss if any really significant and big wins; Discuss what has worked and hasn’t worked. ▪ Talk about upsell ARR development: Which client is especially buying more? What product and why? Talk about what is making it work. ▪ Talk about variance across geographies, if relevant.
 The CFO Handbook | GP Bullhound Page 44 Page 46