
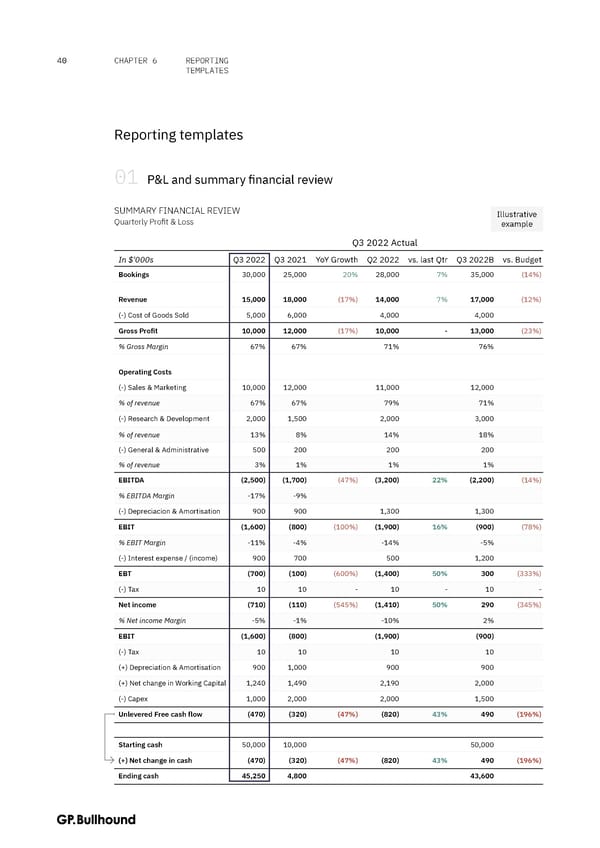
40 CHAPTER 6 REPORTING TEMPLATES Reporting templates 01 P&L and summary financial review SUMMARY FINANCIAL REVIEW Illustrative Quarterly Profit & Loss example Q3 2022 Actual In $'000s Q3 2022 Q3 2021 YoY Growth Q2 2022 vs. last Qtr Q3 2022B vs. Budget Bookings 30,000 25,000 20% 28,000 7% 35,000 (14%) Revenue 15,000 18,000 (17%) 14,000 7% 17,000 (12%) (-) Cost of Goods Sold 5,000 6,000 4,000 4,000 Gross Profit 10,000 12,000 (17%) 10,000 - 13,000 (23%) % Gross Margin 67% 67% 71% 76% Operating Costs (-) Sales & Marketing 10,000 12,000 11,000 12,000 % of revenue 67% 67% 79% 71% (-) Research & Development 2,000 1,500 2,000 3,000 % of revenue 13% 8% 14% 18% (-) General & Administrative 500 200 200 200 % of revenue 3% 1% 1% 1% EBITDA (2,500) (1,700) (47%) (3,200) 22% (2,200) (14%) % EBITDA Margin -17% -9% (-) Depreciacion & Amortisation 900 900 1,300 1,300 EBIT (1,600) (800) (100%) (1,900) 16% (900) (78%) % EBIT Margin -11% -4% -14% -5% (-) Interest expense / (income) 900 700 500 1,200 EBT (700) (100) (600%) (1,400) 50% 300 (333%) (-) Tax 10 10 - 10 - 10 - Net income (710) (110) (545%) (1,410) 50% 290 (345%) % Net income Margin -5% -1% -10% 2% EBIT (1,600) (800) (1,900) (900) (-) Tax 10 10 10 10 (+) Depreciation & Amortisation 900 1,000 900 900 (+) Net change in Working Capital 1,240 1,490 2,190 2,000 (-) Capex 1,000 2,000 2,000 1,500 Unlevered Free cash flow (470) (320) (47%) (820) 43% 490 (196%) Starting cash 50,000 10,000 50,000 (+) Net change in cash (470) (320) (47%) (820) 43% 490 (196%) Ending cash 45,250 4,800 43,600
 The CFO Handbook | GP Bullhound Page 39 Page 41