
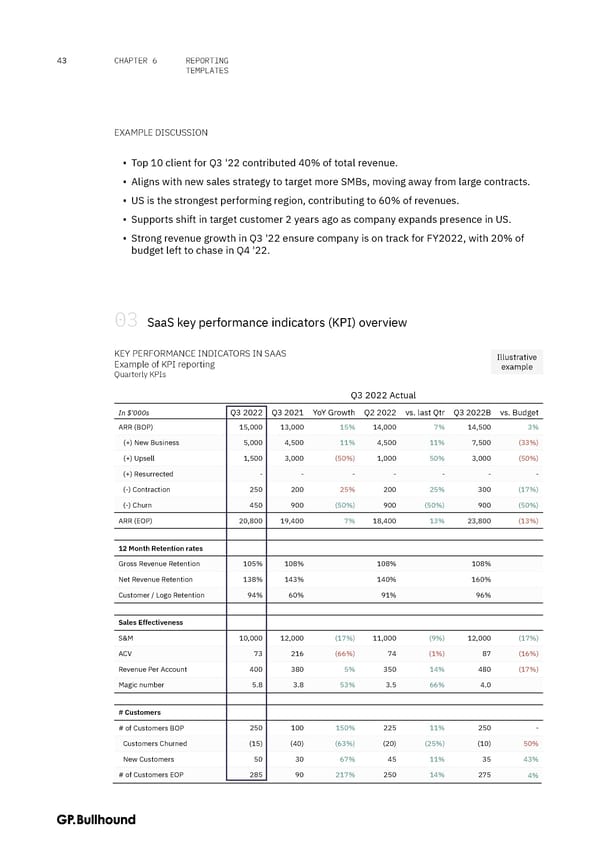
REPORTING 43 CHAPTER 6 TEMPLATES EXAMPLE DISCUSSION ▪ Top 10 client for Q3 '22 contributed 40% of total revenue. ▪ Aligns with new sales strategy to target more SMBs, moving away from large contracts. ▪ US is the strongest performing region, contributing to 60% of revenues. ▪ Supports shift in target customer 2 years ago as company expands presence in US. ▪ Strong revenue growth in Q3 '22 ensure company is on track for FY2022, with 20% of budget left to chase in Q4 '22. 03 SaaS key performance indicators (KPI) overview KEY PERFORMANCE INDICATORS IN SAAS Illustrative Example of KPI reporting example Quarterly KPIs Q3 2022 Actual In $'000s Q3 2022 Q3 2021 YoY Growth Q2 2022 vs. last Qtr Q3 2022B vs. Budget ARR (BOP) 15,000 13,000 15% 14,000 7% 14,500 3% (+) New Business 5,000 4,500 11% 4,500 11% 7,500 (33%) (+) Upsell 1,500 3,000 (50%) 1,000 50% 3,000 (50%) (+) Resurrected - - - - - - - (-) Contraction 250 200 25% 200 25% 300 (17%) (-) Churn 450 900 (50%) 900 (50%) 900 (50%) ARR (EOP) 20,800 19,400 7% 18,400 13% 23,800 (13%) 12 Month Retention rates Gross Revenue Retention 105% 108% 108% 108% Net Revenue Retention 138% 143% 140% 160% Customer / Logo Retention 94% 60% 91% 96% Sales Effectiveness S&M 10,000 12,000 (17%) 11,000 (9%) 12,000 (17%) ACV 73 216 (66%) 74 (1%) 87 (16%) Revenue Per Account 400 380 5% 350 14% 480 (17%) Magic number 5.8 3.8 53% 3.5 66% 4.0 # Customers # of Customers BOP 250 100 150% 225 11% 250 - Customers Churned (15) (40) (63%) (20) (25%) (10) 50% New Customers 50 30 67% 45 11% 35 43% # of Customers EOP 285 90 217% 250 14% 275 4%
 The CFO Handbook | GP Bullhound Page 42 Page 44