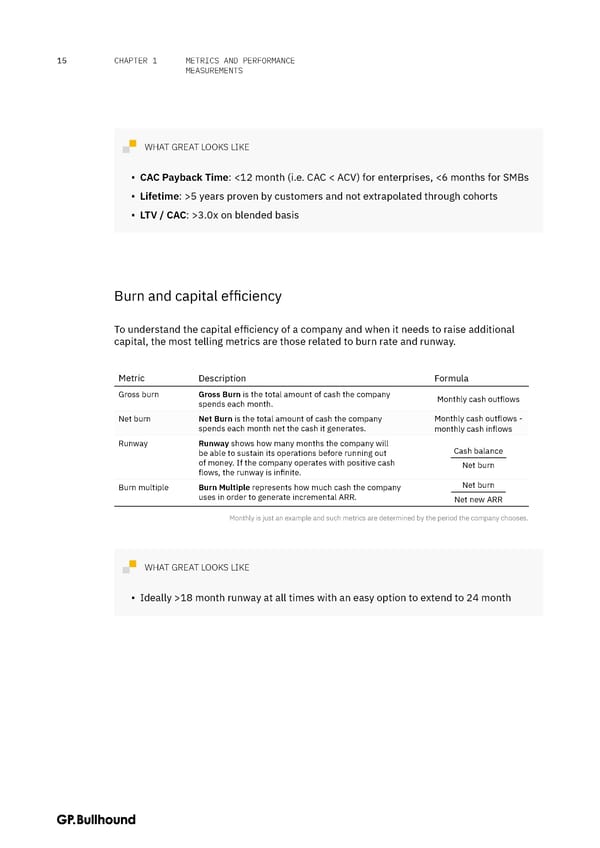
METRICS AND PERFORMANCE 15 CHAPTER 1 MEASUREMENTS WHAT GREAT LOOKS LIKE ▪ CAC Payback Time: <12 month (i.e. CAC < ACV) for enterprises, <6 months for SMBs ▪ Lifetime: >5 years proven by customers and not extrapolated through cohorts ▪ LTV / CAC: >3.0x on blended basis Burn and capital efficiency To understand the capital efficiency of a company and when it needs to raise additional capital, the most telling metrics are those related to burn rate and runway. Metric Description Formula Gross burn Gross Burn is the total amount of cash the company Monthly cash outflows spends each month. Net burn Net Burn is the total amount of cash the company Monthly cash outflows - spends each month net the cash it generates. monthly cash inflows Runway Runway shows how many months the company will Cash balance be able to sustain its operations before running out of money. If the company operates with positive cash Net burn flows, the runway is infinite. Burn multiple Burn Multiple represents how much cash the company Net burn uses in order to generate incremental ARR. Net new ARR Monthly is just an example and such metrics are determined by the period the company chooses. WHAT GREAT LOOKS LIKE ▪ Ideally >18 month runway at all times with an easy option to extend to 24 month
 The CFO Handbook | GP Bullhound Page 14 Page 16